Reference & Glossary
A quick-lookup chapter: the dashboard, metrics definitions, a permission cheat-sheet, and a glossary of every term used in this guide.
1. The Dashboard (your real-time floor view)
The Dashboard (the home screen, /) is a customizable grid of widgets — the
screen a supervisor lives in. Widgets are scoped: a supervisor's queue/agent
widgets show only their own queues and team; an agent sees only their own stats.
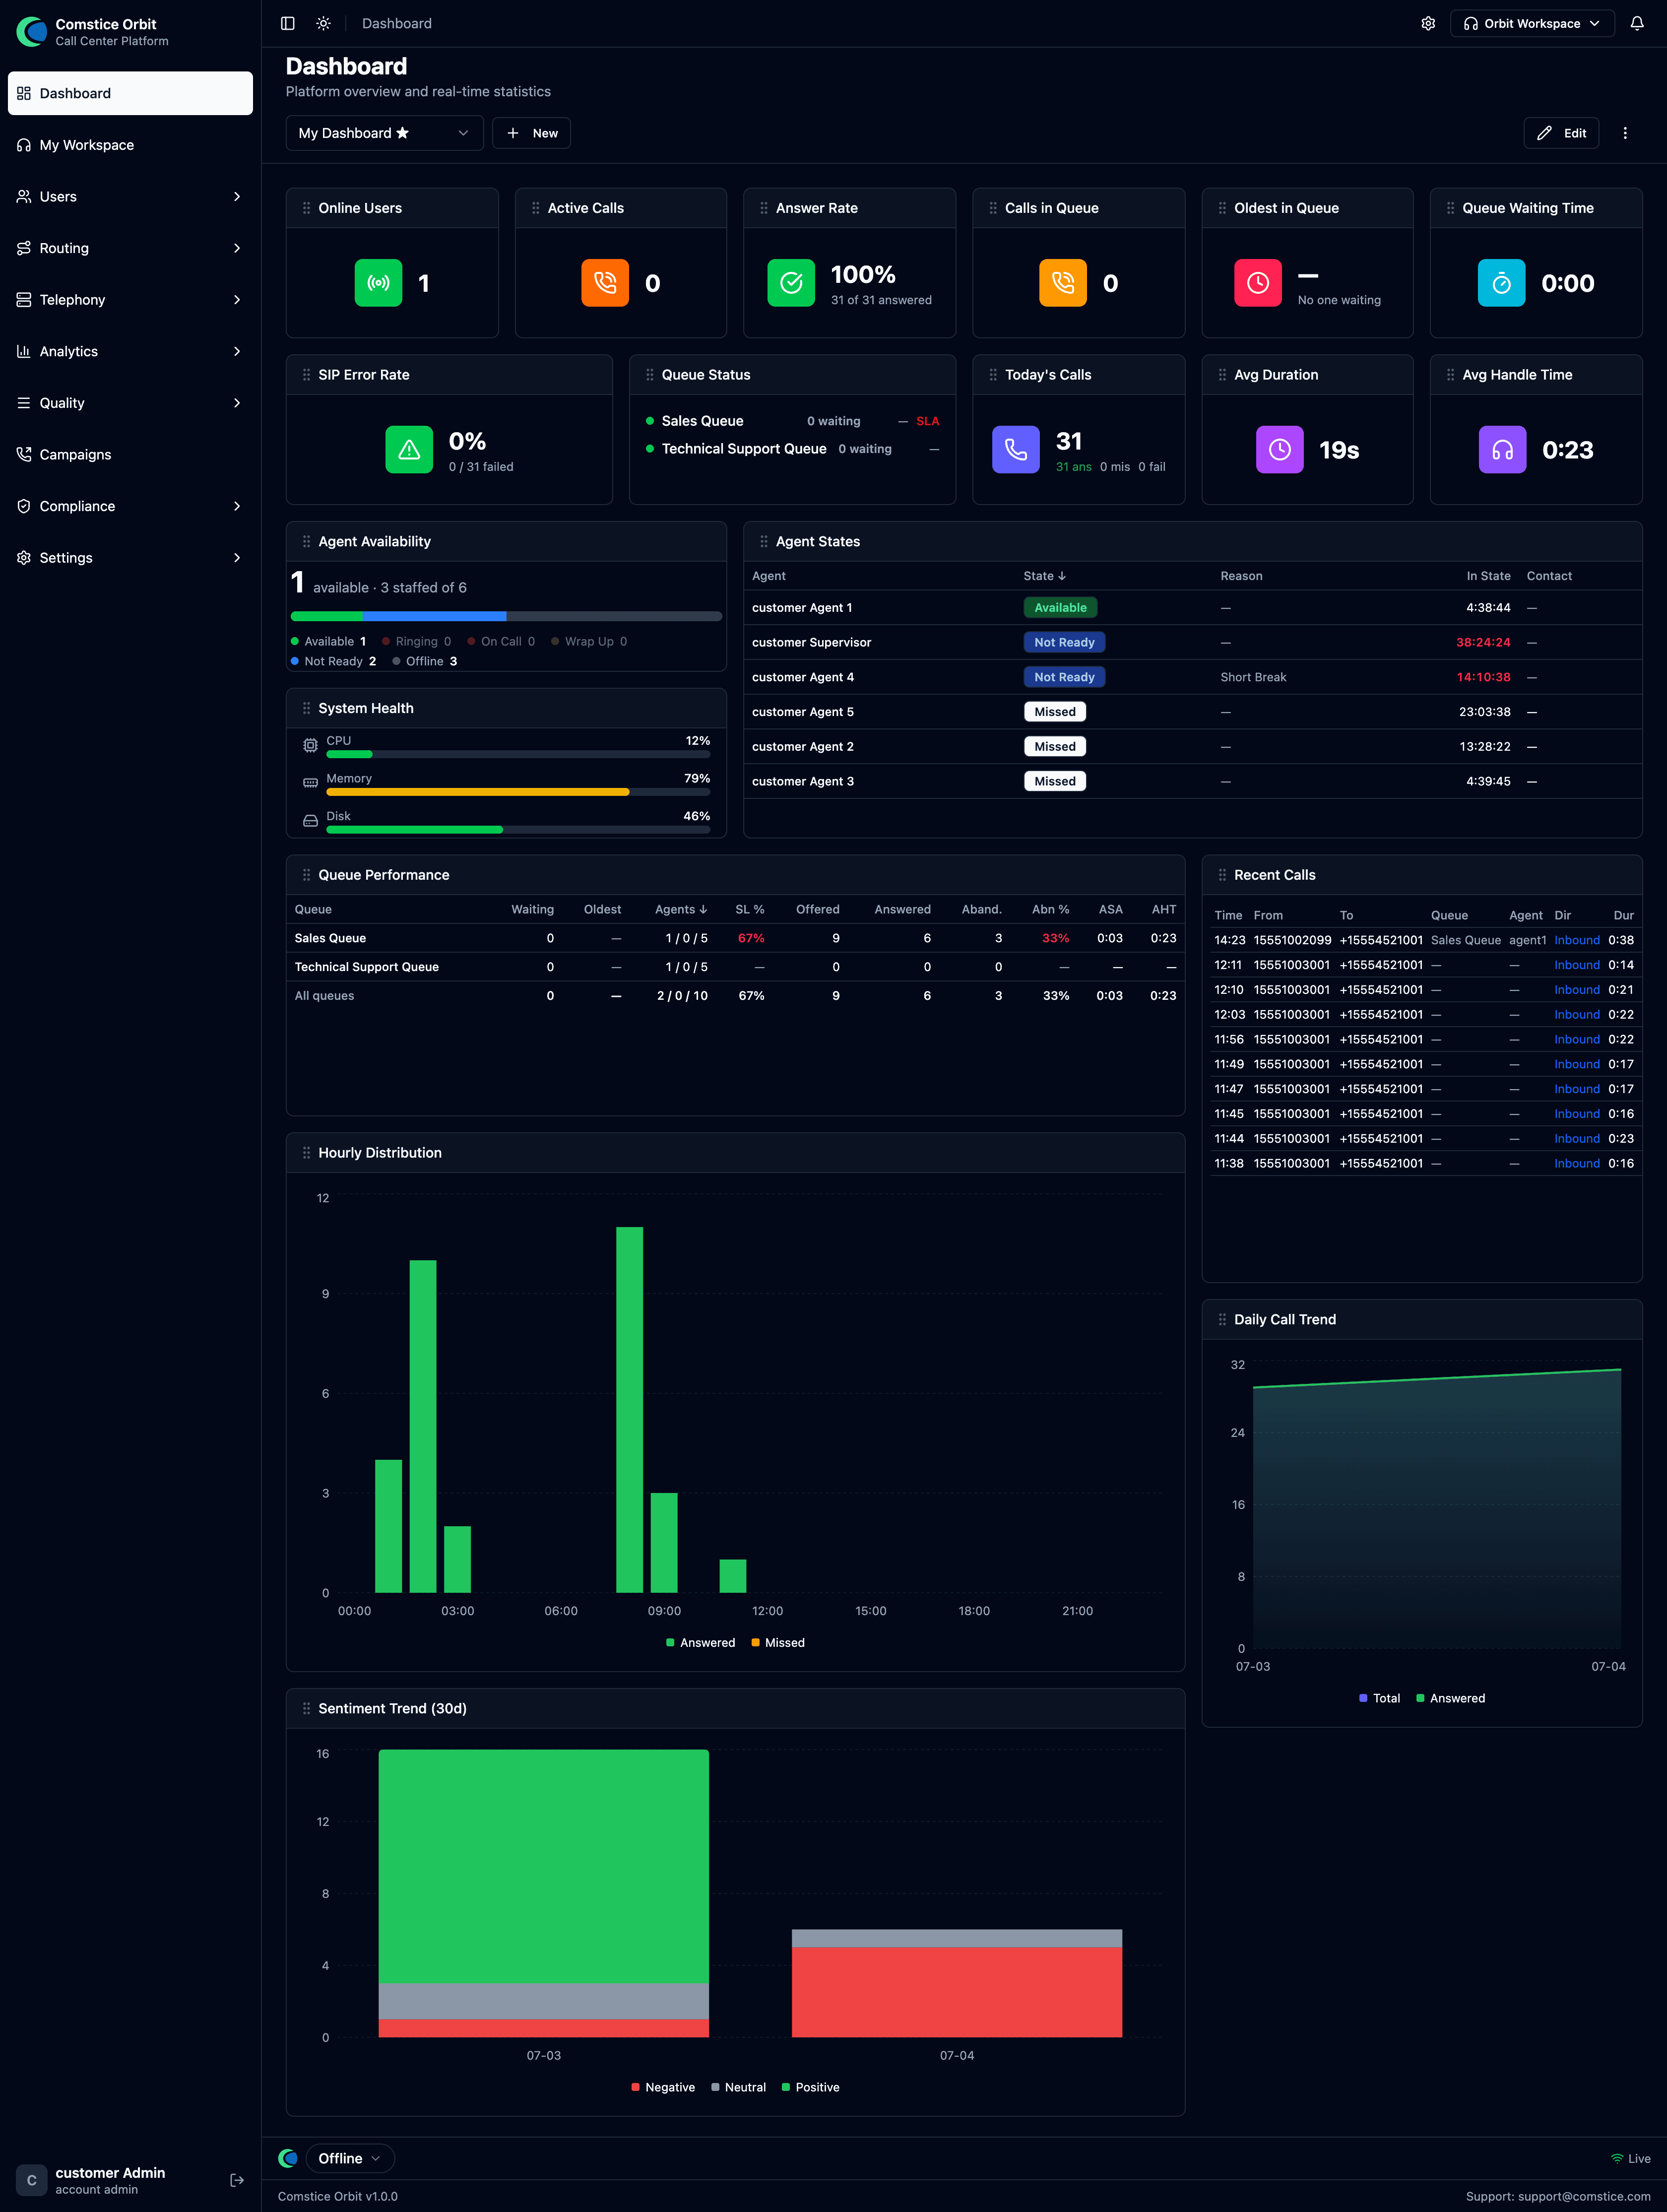
To customize: click Edit → Add Widget, pick from the catalog, drag to rearrange (the layout is responsive), then Done. Removed widgets can be re-added; some sentiment widgets need real-time transcription enabled.
Per-widget filters & thresholds (Edit mode)
In Edit mode each widget grows a small toolbar in its header — this is how you filter and tune widgets individually:
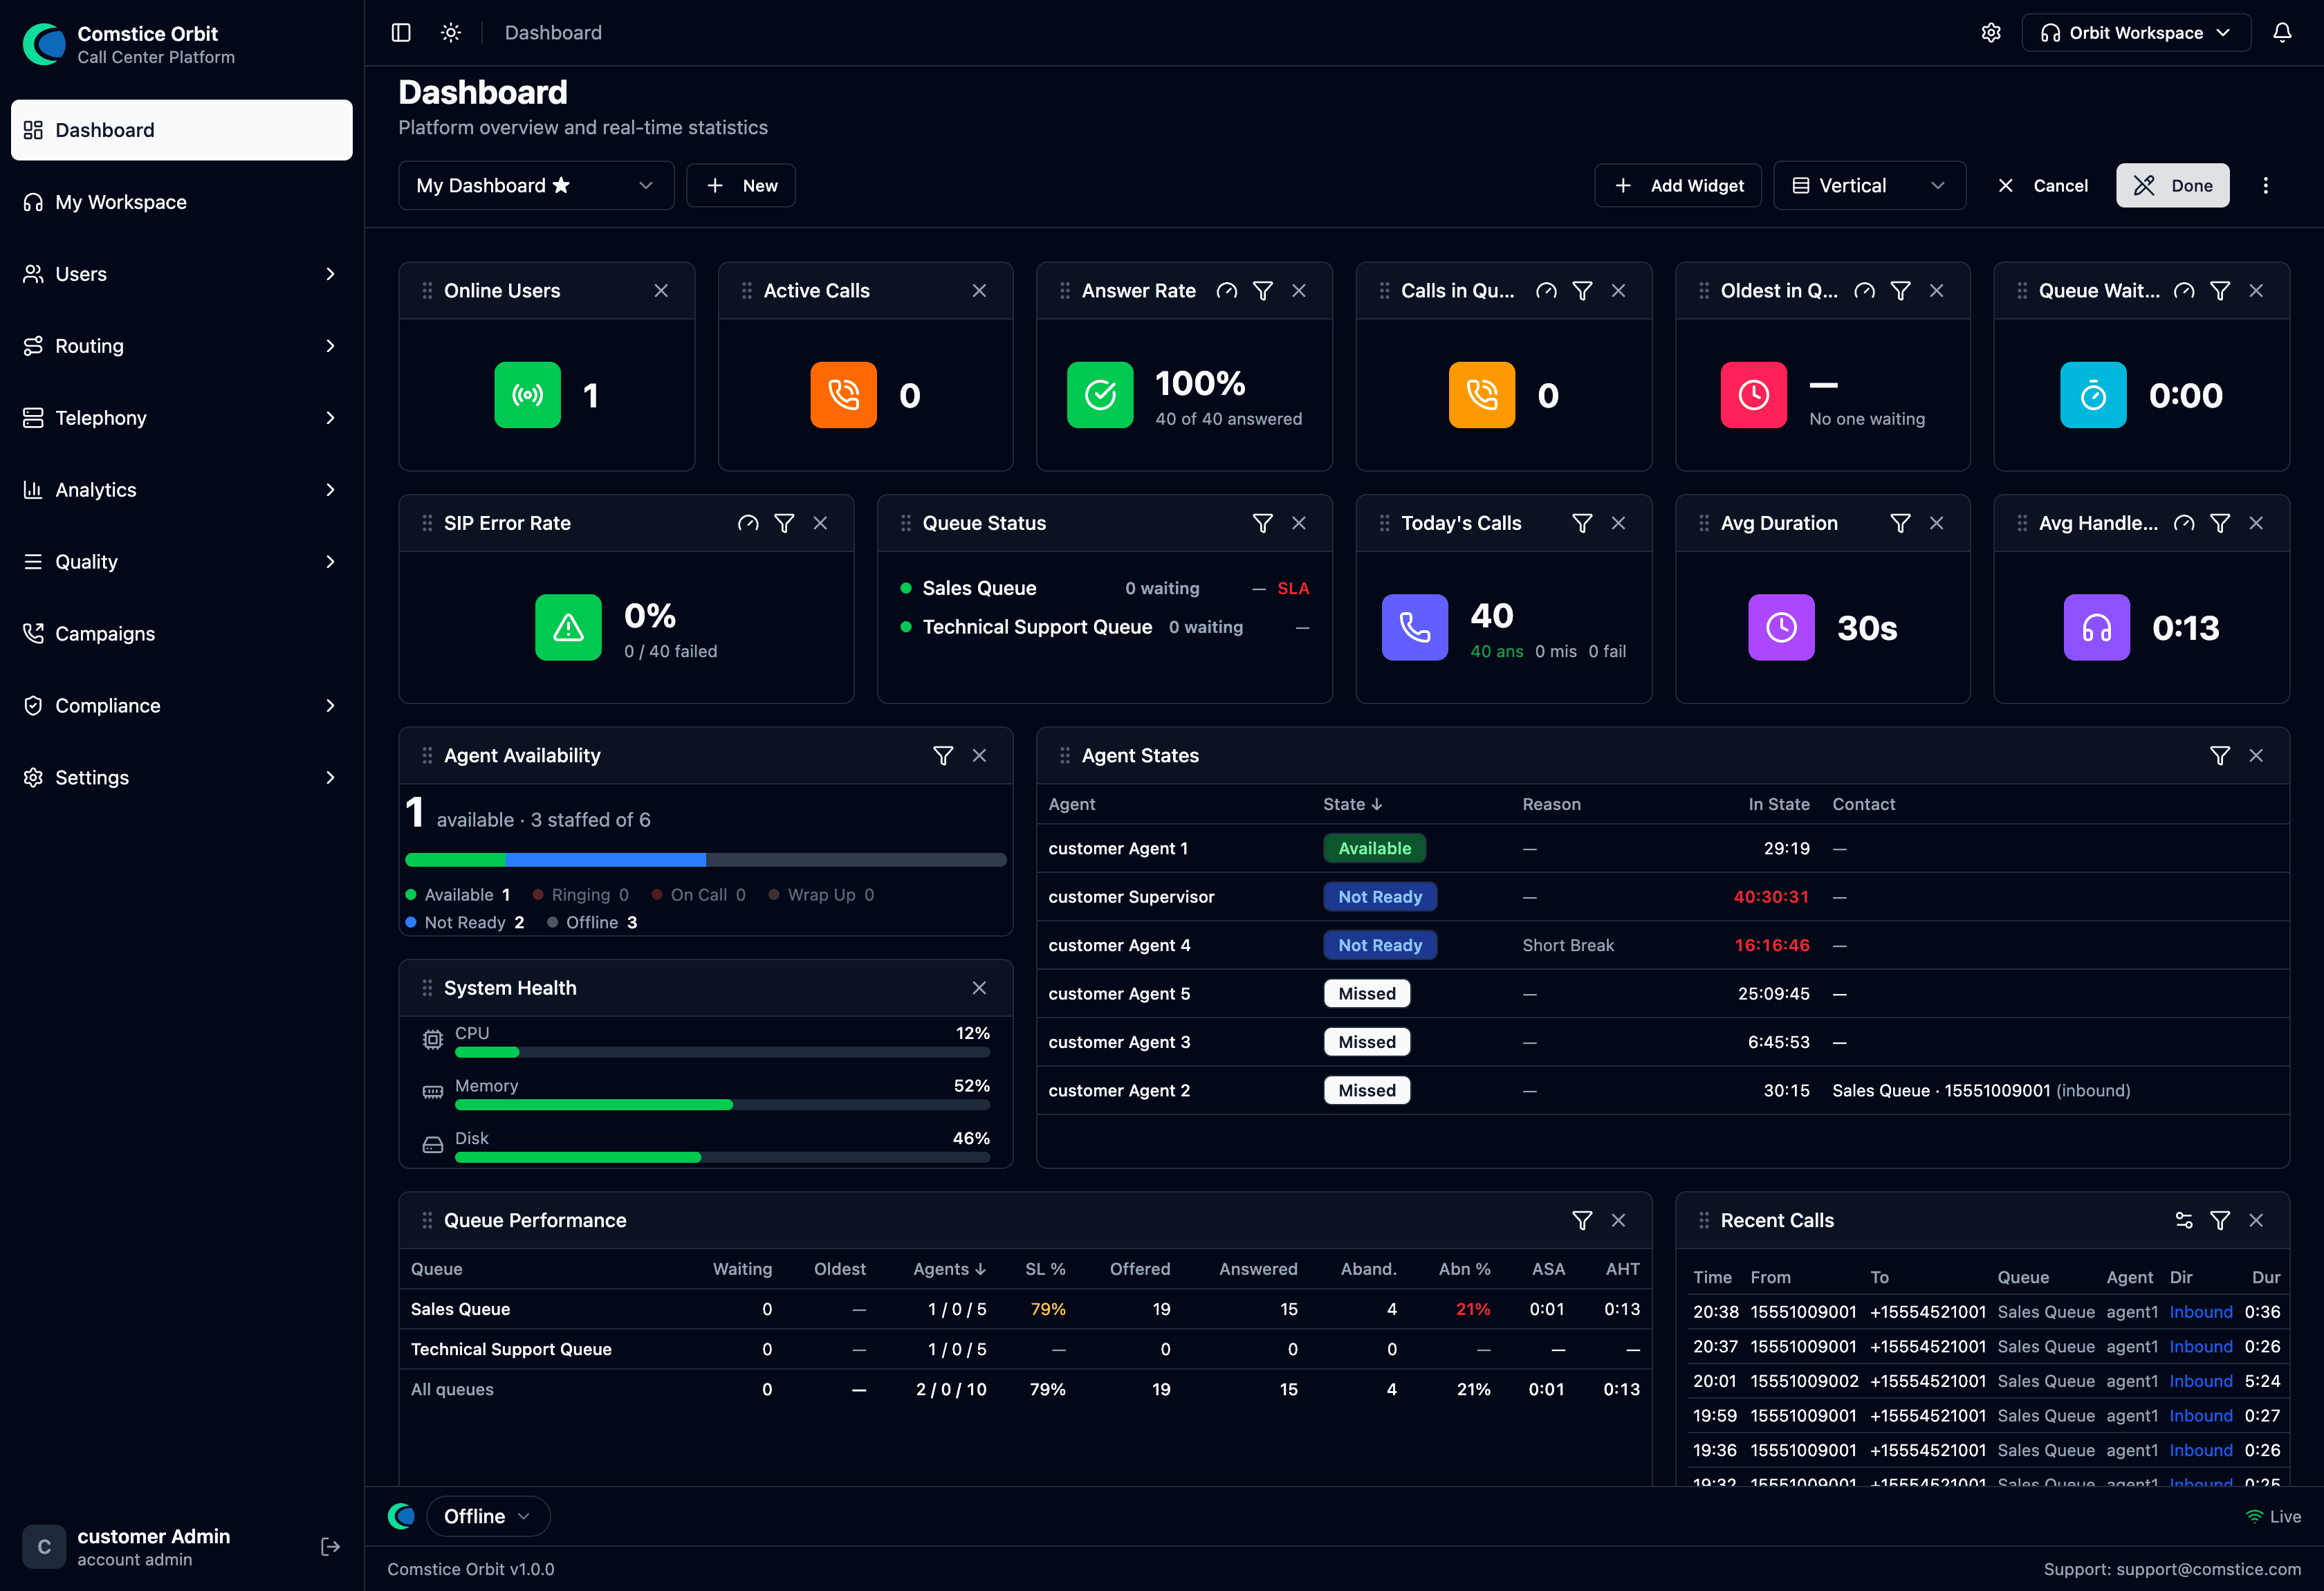 Edit mode. Every widget shows a funnel (filter) icon, many show a gauge (threshold) icon, and an × to remove it. The top bar adds Add Widget and a layout toggle (Vertical).
- Filter (funnel) icon — scope this one widget to a specific queue or agent (or a subset), independently of the rest of the board. So you can put a "Calls in Queue" tile for Sales next to one for Support, or an "Answer Rate" filtered to a single team.
- Threshold (gauge) icon — set the alert thresholds for a KPI tile (e.g. turn Answer Rate red below a target, or flag Oldest-in-Queue over N seconds).
- × (remove) — take the widget off the board (re-add it later from Add Widget).
Filters are per-widget and per-dashboard, so you can build several saved dashboards (the My Dashboard ▾ switcher) — e.g. one scoped to Sales, one to Support — and flip between them.
Widget catalog
Statistics (live KPI tiles)
| Widget | What it shows |
|---|---|
| Online Users | Agents currently signed in. |
| Today's Calls | Total calls today (answered / missed / failed). |
| Answer Rate | % of offered calls that were answered (no time bound). Not the same as Service Level — see the metrics definitions. |
| Active Calls | Calls in progress right now. |
| Avg Duration | Average call length. |
| Avg Handle Time | AHT = talk + hold + wrap-up. |
| Calls in Queue | Callers waiting right now. |
| Oldest in Queue | Longest current wait — watch this for SLA risk. |
| Queue Waiting Time | Current average wait. |
| Queue Status | Per-queue board: waiting count, agents, and an SLA indicator. |
| System Health / SIP Error Rate / Call Limit | Platform health tiles (more for admins). |
Charts
| Widget | What it shows |
|---|---|
| Today's Sentiment / Sentiment by Agent / Emotion Breakdown / Caller vs Agent | Sentiment views (need real-time transcription). |
| Monthly Trend / Daily Call Trend / Hourly Distribution | Volume trends over time. |
| Call Direction / Registration Trend | Inbound vs outbound mix; SIP registration trend. |
Tables
| Widget | What it shows |
|---|---|
| Top Users | Agent leaderboard by weighted sentiment/volume. |
| Recent Calls | The latest calls. |
| Negative Calls | Calls needing attention (needs real-time transcription). |
| Online by Domain | Online users per tenant/domain. |
A supervisor's day (operating flow)
- Morning: open the Dashboard — check Online Users, Calls in Queue, Oldest in Queue, Answer Rate, and Queue Status SLA. Staff accordingly.
- Throughout the day: keep Agent States (Ch. 2) and Live Monitor (Ch. 6) open. Watch live sentiment alerts on Live Monitor; Monitor → Whisper → Barge → Intercept when a call needs you.
- Coaching: use Sentiment Dashboard (Ch. 7) to find negative/low-scoring calls → open Call Review → Evaluate with a scorecard (Ch. 8).
- QA cycle: run evaluations, let agents acknowledge/dispute, and calibrate evaluators periodically.
- End of day: review trends (Monthly/Daily), Top Users, and Negative Calls; export Call Records if you report to your own manager.
2. Metrics definitions
Know what each number means. Contact-center metrics split into two families, and mixing them up is the most common reporting mistake:
- Real-time metrics are current counts and state — "how many callers are waiting right now." They go up and down live.
- Historical metrics are rates calculated over a period — "what % did we answer in time today." They're averages/percentages, not live counts.
Real-time metrics (current counts & state)
| Metric | What it means | In Orbit |
|---|---|---|
| Contacts / Calls in Queue | Callers waiting in the queue, not yet connected to an agent. | Calls in Queue tile; Queue Status waiting count. |
| Oldest in Queue | Age of the longest-waiting caller right now — the number to watch for SLA risk. | Oldest in Queue tile. |
| Available agents | Agents whose status is Available and who can take an inbound call now. | See the note below on Online Users — it's not the same thing. |
| Agents on contact | Agents currently handling a call (connected / hold / wrap-up). | Approximated by Active Calls (a call count, not an agent count). |
| Average wait (ASA, live) | Running average wait before answer for the current period. | Queue Waiting Time tile. |
Online Users counts everyone signed in — including agents on Break, in wrap-up, or on a call. It is not the count of agents ready to take a new call. When you're deciding whether to staff up, read the Agent States roster (Ch. 2) for the true Available count, not Online Users.
Historical metrics (rates over a period)
| Metric | Definition & formula | In Orbit |
|---|---|---|
| Service Level (X s) | % of contacts answered within X seconds (X is a configurable threshold, e.g. "Service Level 20" = % answered in under 20 s). The classic contact-center SLA measure. | Live. Each queue has a service-level target (default 80 % within 20 s); the Queue Status widget shows the resulting SLA % and breach alerts. The target is configurable per queue via the API today — a field on the queue form is still to come. |
| Answer Rate | % of offered calls that were answered, with no time bound. | Answer Rate tile. Useful, but it is not Service Level — a call answered after 5 minutes still counts as answered here. |
| Abandonment rate | % of callers who hung up while waiting in queue, before reaching an agent. Formula: (abandoned ÷ queued) × 100. | No dedicated tile; track via Call Records filtered to abandoned. |
| Average Handle Time (AHT) | Average total handling time per call = talk + hold + wrap-up (ACW). | Avg Handle Time tile. |
| Average interaction (talk) time | Average time the agent was actually talking to the customer — excludes hold and wrap-up. | Not a separate tile; don't confuse it with Avg Duration. |
| Average Duration | Average total call length end to end. | Avg Duration tile. Longer than talk time because it includes IVR, queue, hold, and wrap-up. |
| Occupancy | Of an agent's working time (on-contact + idle waiting for a call — excludes breaks/offline), the % spent on contacts (incl. wrap-up). Formula: on-contact ÷ (on-contact + idle) × 100. | Not available today — no occupancy widget. |
| Adherence | % of time an agent followed their schedule (a workforce-management measure). | Not available — Orbit has no scheduling/WFM module. Don't imply it does. |
Avg Duration (whole call) ≠ AHT (talk + hold + wrap-up) ≠ interaction time (talk only). They get bigger in that order. When someone asks "how long are our calls," ask which they mean.
Counting vocabulary. When you filter Call Records, these are the words to use consistently: queued (entered a queue), answered / handled (connected to and handled by an agent), abandoned (hung up in queue before an agent).
3. Permission cheat-sheet
Permissions are resource.action. Common ones, by area:
| Area | Example permissions |
|---|---|
| Users & profiles | users.view, users.edit |
| Queues | queues.view, queues.create, queues.edit, queues.delete |
| Call flows | call_flows.view |
| Routing | routing_profiles.view, call_routes.view |
| Telephony | carriers.view, phone_numbers.view |
| Recordings & transcripts | recordings.view, transcripts.view |
| Sentiment | sentiment.view |
| Supervision | supervision.view, call_control.monitor, call_control.whisper, call_control.barge, call_control.intercept |
| Quality | qa_scorecards.view, qa_evaluations.view, qa_evaluations.review_own, qa_calibration.view |
| Compliance | retention_policy.view, legal_holds.view, access_log.view, dsar.view, consent.view, pii_redaction.view |
| API & integration | api_keys.create, api_keys.delete (needs the api-access license) |
| Softphone | orbit_panel.view |
| Platform | platform_admin (role) |
A user's effective permissions come from their assigned Security Profile (platform roles bypass to all). See Organization & Access.
4. Glossary
| Term | Meaning |
|---|---|
| Abandonment rate | % of callers who hung up in queue before an agent — (abandoned ÷ queued) × 100. |
| ACD | Automatic Call Distributor — decides which waiting caller goes to which agent. |
| ACW | After Contact Work — Orbit's Wrap-Up; post-call notes time, counted in AHT. |
| Adherence | % of time an agent follows their schedule (a WFM metric; not available in Orbit). |
| Agent | A user who handles calls (has a routing profile). |
| AHT | Average Handle Time — talk + hold + wrap-up (ACW). |
| Application | The handler a phone number points at; runs a call flow. |
| ASA | Average Speed of Answer — average wait before a call is answered. |
| Answer Rate | % of offered calls answered (no time bound) — not the same as Service Level. |
| Barge | Supervisor joins a live call so both parties hear them. |
| Call Flow | The visual script Orbit follows for a call (IVR). |
| Call Journey | The chronological timeline of events in one call. |
| Carrier / Trunk | Your connection to a phone provider. |
| DID | Direct Inward Dialing — a phone number customers call. |
| DSAR | Data Subject Access Request — a person's request to see or delete their data. |
| DTMF | The tones from phone keypad presses (touch-tone). |
| Gateway | A network endpoint (IP/port) of a carrier. |
| IVR | Interactive Voice Response — the automated menu ("press 1…"). |
| Legal Hold | A freeze that prevents recordings from being deleted. |
| Longest-idle | Distribution that offers a call to the agent idle the longest. |
| Monitor | Supervisor listens to a live call silently. |
| Occupancy | % of working time (on-contact + idle, excl. breaks) spent on contacts — on-contact ÷ (on-contact + idle) × 100 (not available in Orbit). |
| PII | Personally Identifiable Information. |
| Queue | A waiting room for calls. |
| Retention | How long recordings/transcripts are kept before deletion. |
| Routing Profile | An agent's queue assignments, priorities, and delays. |
| Security Profile | A named bundle of permissions assigned to a user. |
| Service Level (X s) | % of calls answered within X seconds — the classic SLA measure. |
| Sentiment | A positive/neutral/negative score for spoken segments. |
| SIP | The signaling protocol that sets up phone calls. |
| Tenant | One company on the platform, with its own URL and isolated data. |
| View-As | A platform/reseller admin temporarily seeing Orbit as a customer. |
| Whisper | Audio only the agent hears (coaching, or a pre-connect announcement). |
| Wrap-Up | After-call work — notes/disposition an agent enters post-call. |
5. Where to find it (menu map)
This guide is organized by topic, but the Orbit app groups screens into a few menus. Use this map to jump from a screen you're looking at to the chapter that explains it.
| App menu | Screen | Explained in |
|---|---|---|
| Dashboard | Dashboard | §1 above |
| My Workspace | Softphone (in-app) | Handling Calls |
| Users | Users | Org & Access §4 |
| Routing Profiles | Agents & Teams §1 | |
| Agent States | Agents & Teams §3 | |
| Security Profiles | Org & Access §3 | |
| Agent Hierarchy | Agents & Teams §2 | |
| Routing | Call Flows | Call Flows |
| Queues | Queues & ACD | |
| Business Hours | Queues & ACD §3 | |
| Call Routes | Telephony §5 | |
| Wrap-Up Forms | Handling Calls §5 | |
| Quick Connects | Handling Calls §4 | |
| Telephony | Phone Numbers | Telephony §3 |
| SIP Trunks | Telephony §2 | |
| Outbound Routes | Telephony §5 | |
| Analytics | Call Records / Review | Recordings & AI §5 |
| Sentiment Dashboard | Recordings & AI §4 | |
| Live Monitor | Handling Calls §13 | |
| Supervisor Monitoring | Handling Calls §8 | |
| Transcript Search | Recordings & AI §7 | |
| Quality | Evaluations / Scorecards / My Evaluations / Calibration | Quality Assurance |
| Campaigns | Campaigns | Developer §7 |
| Compliance | Retention / Legal Holds / Access Log / Consent / GDPR-DSAR / PII Redaction | Compliance |
| Settings | System Settings | Compliance §9 |
| API Keys | Developer §2 | |
| (platform admin) | Accounts / Service Providers / Plans / Licensing | Org & Access §2 |
| Cluster Config | Org & Access §2 |